DIGIT Core
PlatformDomainsAcademyDesign SystemFeedback
2.8
2.8
  • ☑️Introducing DIGIT Platform
    • DIGIT - Value Proposition
  • Platform
    • 🔎Overview
      • Principles
      • Architecture
        • Service Architecture
        • Infrastructure Architecture
        • Deployment Architecture
      • Technology
        • API Gateway
        • Open Source Tools
      • Checklists
        • API Checklist
        • Security Checklist
          • Security Guidelines Handbook
          • Security Flow - Exemplar
        • Performance Checklist
        • Deployment Checklist
      • UI Frameworks
        • React UI Framework
    • 🔧Core Services
      • Workflow Service
        • Setting Up Workflows
        • Configuring Workflows For An Entity
        • Workflow Auto Escalation
        • Migration To Workflow 2.0
      • Location Services
      • User Services
      • Access Control Services
      • PDF Generation Service
      • MDMS (Master Data Management Service)
        • Setting up Master Data
          • MDMS Overview
          • MDMS Rewritten
          • Configuring Tenants
          • Configuring Master Data
          • Adding New Master
          • State Level Vs City Level Master
      • Payment Gateway Service
      • User Session Management
      • Indexer Service
        • Indexer Configuration
      • URL Shortening Service
      • XState Core Chatbot
        • Xstate-Chatbot Message Localisation
        • XState-Chatbot Integration Document
      • NLP Engine Service
        • NLP Chatbot
      • SMS Template Approval Process
      • Telemetry Service
      • Document Uploader Service
      • Notification Enhancement Based On Different Channel
      • Report Service
        • Configuring New Reports
          • Impact Of Heavy Reports On Platform
          • Types Of Reports Used In Report Service
      • SMS Notification Service
        • Setting Up SMS Gateway
          • Using The Generic GET & POST SMS Gateway Interface
      • Survey Service
      • Persister Service
        • Persister Configuration
      • Encryption Service
        • Encryption Client Library
        • User Data Security Architecture
        • Guidelines for supporting User Privacy in a module
      • FileStore Service
      • ID Generation Service
      • Localization Service
        • Configuring Localization
          • Setup Base Product Localization
          • Configure SMS and Email
      • Email Notification Service
      • Searcher Service
      • Zuul Service
      • User OTP Service
      • OTP Service
      • Chatbot Service
      • National Dashboard Ingest
        • National Dashboard API Performance Testing Specs and Benchmark
        • National Dashboard: Steps for Index Creation
        • National Dashboard Adaptor Service
          • Deployment of Airflow DAG
          • Trigger Airflow DAG
          • Configure Airflow
          • Insert & Delete Data - Steps
          • Important Links & Credentials
          • Code Structure
          • KT Sessions
          • Pre-requisites For Enabling Adaptor
        • Revenue Maximisation
      • Audit Service
        • Signed Audit Performance Testing Results
      • Service Request
      • Self Contained Service Architecture (HLD)
      • Accelerators
        • Inbox Service
    • ✏️API Specifications
      • User
      • Access Control
      • Employee
      • Location
      • Localisation
      • Encryption
      • Indexer
      • File Store
      • Collection
      • DSS Ingest
      • HRMS
      • National Dashboard Ingest
      • WhatsApp Chatbot
      • Master Data Management
      • ID Generation
      • URL Shortner
      • Workflow Service
      • Workflow v2
      • Document Uploader Service
      • OTP Service
      • Reporting Service
      • PDF Generation Service
      • Payment Gateway Service
    • 🔐Data Protection & Privacy
      • Data Protection & Privacy Definitions
      • Legal Obligations For Privacy - eGov
      • Data Protection & Privacy - Global Best Practices
      • Guidelines
        • Platform Owner Guidelines
        • Implementing Agencies Guidelines
        • Admin Guidelines
        • Program Owner Guidelines
        • Data Security and Data Privacy
      • Data Privacy Policy Templates
        • eGov Data Privacy Policy
        • Implementing Agency Privacy Policy
        • Admin & Program Owner Privacy Policy
        • Supporting Agency Privacy Policy
      • Global Standards For All Roles
    • ▶️Get Started
      • Install DIGIT
      • Access DIGIT
      • Sandbox
      • Training and Certification
        • Training Resources
    • ⚒️Integrations
      • Payment
      • Notification
      • Transaction
      • Verification
      • View
      • Calculation
    • 🛣️Roadmap
    • 🎬Open Events
    • 👩‍💻Source Code
    • 👁️Project Plan
    • 📋Discussion Board
    • 🤝Contribute
  • Guides
    • 📓Installation Guide
      • DIGIT Deployment
      • Quick Setup
        • DIGIT Installation on Azure
        • DIGIT Installation on AWS
      • Production Setup
        • AWS
          • 1. Pre-requisites
          • 2. Understanding EKS
          • 3. Setup AWS Account
          • 4. Provisioning Infra Using Terraform
          • 5. Prepare Deployment Config
          • 6. Deploy DIGIT
          • 7. Bootstrap DIGIT
          • 8. Productionize DIGIT
          • FAQ
        • Azure
          • 1. Azure Pre-requisites
          • 2. Understanding AKS
          • 3. Infra-as-code (Terraform)
        • SDC
          • 1. SDC Pre-requisites
          • 2. Infra-as-code (Kubespray)
          • CI/CD Setup On SDC
        • CI/CD Set Up
          • CI/CD Build Job Pipeline Setup
        • Prepare Helm Release Chart
        • Deployment - Key Concepts
          • Security Practices
          • Readiness & Liveness
          • Resource Requests & Limits
          • Deploying DIGIT Services
          • Deployment Architecture
          • Routing Traffic
          • Backbone Deployment
    • 💽Data Setup Guide
      • User Module
      • Localisation Module
      • Location Module
    • 🚥Design Guide
      • Model Requirements
      • Design Services
      • Design User Interface
      • Checklists
    • ⚒️Developer Guide
      • Pre-requisites Training Resources
      • Backend Developer Guide
        • Section 0: Prep
          • Development Pre-requisites
          • Design Inputs
            • High Level Design
            • Low Level Design
          • Development Environment Setup
        • Section 1: Create Project
          • Generate Project Using API Specs
          • Create Database
          • Configure Application Properties
          • Import Core Models
          • Implement Repository Layer
          • Create Validation & Enrichment Layers
          • Implement Service Layer
          • Build The Web Layer
        • Section 2: Integrate Persister & Kafka
          • Add Kafka Configuration
          • Implement Kafka Producer & Consumer
          • Add Persister Configuration
          • Enable Signed Audit
          • Run Application
        • Section 3: Integrate Microservices
          • Integrate IDGen Service
          • Integrate User Service
          • Add MDMS Configuration
          • Integrate MDMS Service
          • Add Workflow Configuration
          • Integrate Workflow Service
          • Integrate URL Shortener Service
        • Section 4: Integrate Billing & Payment
          • Custom Calculator Service
          • Integrate Calculator Service
          • Payment Back Update
        • Section 5: Other Advanced Integrations
          • Add Indexer Configuration
          • Certificate Generation
        • Section 6: Run Final Application
        • Section 7: Build & Deploy Instructions
        • FAQs
      • Flutter UI Developer Guide
        • Introduction to Flutter
          • Flutter - Key Features
          • Flutter Architecture & Approach
          • Flutter Pre-Requisites
        • Setup Development Environment
          • Flutter Installation & Setup Guide
          • Setup Device Emulators/Simulators
          • Run Application
        • Build User Interfaces
          • Create Form Screen
        • Build Deploy & Publish
          • Build & Deploy Flutter Web Application
          • Generate Android APKs & App Bundles
          • Publishing App Bundle To Play Store
        • State Management With Provider & Bloc
          • Provider State Management
          • BloC State Management
        • Best Practices & Tips
        • Troubleshooting
      • UI Developer Guide
        • DIGIT-UI
        • Android Web View & How To Generate APK
        • DIGIT UI Development Pre-requisites
        • UI Configuration (DevOps)
        • Local Development Setup
        • Run Application
        • Create New Screen In DIGIT-UI
          • Create Screen (FormComposer)
          • Inbox/Search Screen
          • Workflow Component
        • Customisation
          • Integrate External Web Application/UI With DIGIT UI
          • Utility - Pre-Process MDMS Configuration
          • CSS Customisation
        • Citizen Module Setup
          • Sample screenshots
          • Project Structure
          • Install Dependency
          • Import Required Components
          • Write Citizen Module Code
          • Citizen Landing Screen
        • Employee Module Setup
          • Write Employee Module Code
        • Build & Deploy
        • Setup Monitoring Tools
        • FAQs
          • Troubleshoot Using Browser Network Tab
          • Debug Android App Using Chrome Browser
    • 🔄Operations Guide
      • DIGIT - Infra Overview
      • Setup Central Instance Infra
      • Central Monitoring Dashboard Setup
      • Kubernetes
        • RBAC Management
        • DB Dump - Playground
      • Setup Jenkins - Docker way
      • GitOps
        • Git Client installation
        • GitHub organization creation
        • Adding new SSH key to it
        • GitHub repo creation
        • GitHub Team creation
        • Enabling Branch protection:
        • CODEOWNER Reviewers
        • Adding Users to the Git
        • Setting up an OAuth with GitHub
        • Fork (Fork the mdms,config repo with a tenant-specific branch)
      • Working with Kubernetes
        • Installation of Kubectl
      • Containerizing application using Docker
        • Creation of Dockerhub account
      • Infra provisioning using Terraform
        • Installation of Terraform
      • Customization of existing tf templates
      • Cert-Manager
        • Obtaining SSL certificates with the help of cluster-issuer
      • Moving Docker Images
      • Pre and post deployment checklist
      • Multi-tenancy Setup
      • Availability
        • Infrastructure
        • Backbone services
          • Database
          • Kafka
          • Kafka Connect
          • Elastic search
            • ElasticSearch Direct Upgrade
            • Elastic Search Rolling Upgrade
        • Core services
        • DIGIT apps
        • DSS dashboard
      • Observability
        • ES-Curator to clear old logs/indices
        • Monitoring
        • Tracing
        • Jaeger Tracing Setup
        • Logging
        • eGov Monitoring & Alerting Setup
        • eGov Logging Setup
      • Performance
        • What to monitor?
          • Infrastructure
          • Backbone services
          • Core services
        • Identifying bottlenecks
        • Solutions
      • Handling errors
      • Security
      • Reliability and disaster recovery
      • Privacy
      • Skillsets/hiring
      • Incident management processes
      • Kafka Troubleshooting Guide
        • How to clean up Kafka logs
        • How to change or reset consumer offset in Kafka?
      • SRE Rituals
      • FAQs
        • I am unable to login to the citizen or employee portal. The UI shows a spinner.
        • My DSS dashboard is not reflecting accurate numbers? What can I do?
      • Deployment using helm
        • Helm installation:
        • Helm chart creation
        • Helm chart customization
      • How to Dump Elasticsearch Indexes
      • Deploy Nginx-Ingress-Controller
      • Deployment Job Pipeline Setup
      • OAuth2-Proxy Setup
      • Jira Ticket Creation
  • Reference
    • 👉Setup Basics
      • Setup Requirements
        • Tech Enablement Training - Essential Skills and Pre-requisites
        • Tech Enablement Training (eDCR) - Essential Skills and Prerequisites
          • Development Control Rules (Digit-DCR)
          • eDCR Approach Guide
        • DIGIT Rollout Program Governance
        • DevOps Skills Requirements
        • Infra Requirements
        • Team Composition for DIGIT Implementation
        • Infra Best Practices
        • Operational Best Practices
        • Why Kubernetes For DIGIT
      • Supported Clouds
        • Google Cloud
        • Azure
        • AWS
        • VSphere
        • SDC
      • Deployment - Key Concepts
        • Security Practices
        • CI/CD
        • Readiness & Liveness
        • Resource Requests & Limits
      • Understanding ERP Stack
        • ERP Monolithic Architecture
        • ERP Hybrid Architecture
        • ERP Coexistence Architecture
        • APMDP-HYBRID-INFRA ARCHITECTURE
        • eGov SmartCity eGovernance Suite
        • ERP Deployment Process
        • ERP Release Process
        • ERP User Guide
      • Deploying DIGIT Services
        • Deployment Architecture
        • Routing Traffic
        • Backbone Deployment
      • Troubleshooting
        • Distributed Tracing
        • Logging
        • Monitoring & Alerts
    • 📥Reference Reads
      • Analytics
      • DevSecOps
      • Low Code No Code
        • Application Specification
      • Beneficiary Eligibility
      • Government and Open Digital Platforms
      • Microservices and Low Code No Code
      • Registries
      • Platform Orientation - Overview
    • 🔏Data Security
      • Signed Data Audit
      • Encryption Techniques
      • Approaches to handle Encrypted Data
    • ❕Privacy
    • 🕹️DevOps
      • 1. How DNS works
      • 2. Load Balancer
      • 3. SSL/Cert-manager
      • 4.Ingress,WAF
      • 5.VPC
      • 6.Subnets
      • 7.EKS
      • 8.Worker Node Group
      • 9.RDS
      • 10.NAT
      • 11.Internet Gateway
      • 12.Block Storage (EBS Volumes)
      • 13.Object Storage (S3)
      • 14. Telemetry
Powered by GitBook

All content on this page by eGov Foundation is licensed under a Creative Commons Attribution 4.0 International License.

On this page
  • Introduction
  • Prometheus
  • Concepts
  • Why Choose The Prometheus Operator?
  • Deploying Prometheus With The Operator
  • Installing Helm
  • Creating the dedicated monitoring namespace
  • Installing kube-prometheus-stack with Helm
  • Connecting To Prometheus Web Interface
  • Connecting To Grafana

Was this helpful?

  1. Guides
  2. Operations Guide
  3. Observability

Monitoring

PreviousES-Curator to clear old logs/indicesNextTracing

Last updated 2 years ago

Was this helpful?

There are many monitoring tools out there. Before choosing what we would work with on our clients Clusters, we had to take many things into consideration. We use Prometheus and Grafana for Monitoring of our and our client’s clusters.

Introduction

Monitoring is an important pillar of DevOps best practices. This gives you important information about the performance and status of your platform. This is even more true in distributed environments such as Kubernetes and microservices.

One of Kubernetes’ great strengths is its ability to extend its services and applications. When you reach thousands of applications, it’s impractical to manually monitor or use scripts. You need to adopt a scalable surveillance system! This is where Prometheus and Grafana come in.

Prometheus makes it possible to collect, store, and use platform metrics. Grafana, on the other hand, connects to Prometheus, allowing you to create beautiful dashboards and charts.

Today we’ll talk about what Prometheus is and the best way to deploy it to Kubernetes, with the operator. We will see how to set up a monitoring platform using Prometheus and Grafana.

This tutorial provides a good starting point for observability and goes a step further!

Prometheus

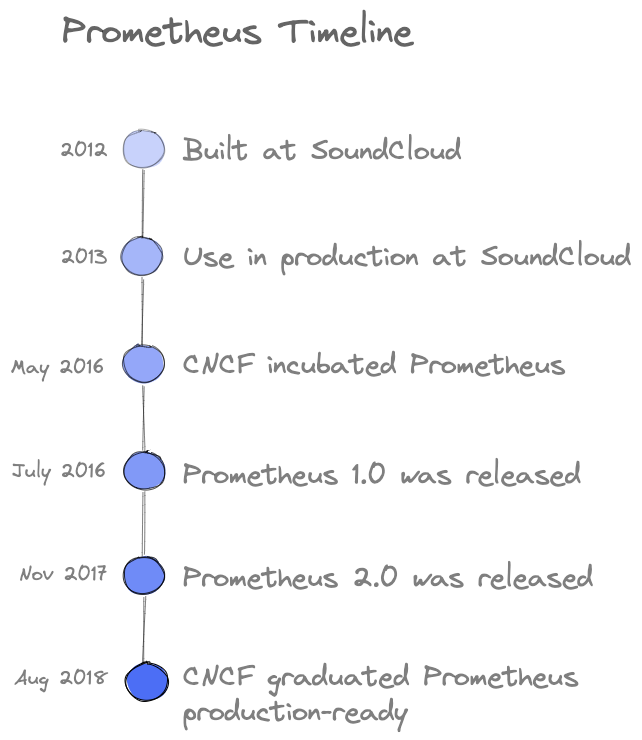
Prometheus is a free open source event monitoring and notification application developed on SoundCloud in 2012. Since then, many companies and organizations have adopted and contributed to them. In 2016, the Cloud Native Computing Foundation (CNCF) launched the Prometheus project shortly after Kubernetes

The timeline below shows the development of the Prometheus project.

Concepts

Metrics exposed by a Prometheus target has the following format: <metric name>{<label name>=<label value>, ...}

Prometheus records real-time metrics in a time series database (TSDB). It provides a dimensional data model, ease of use, and scalable data collection. It also provides PromQL, a flexible query language to use this dimensionality.

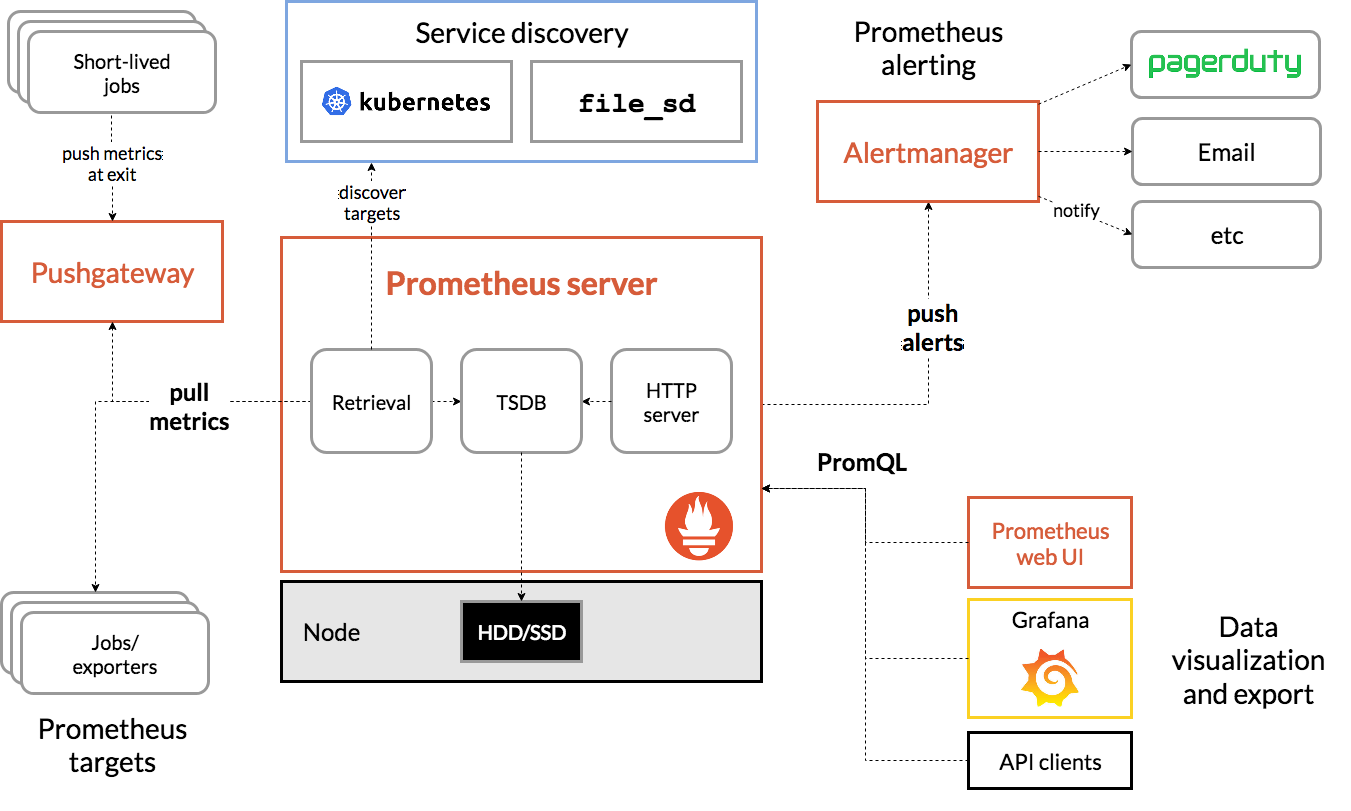
The above architecture diagram shows that Prometheus is a multi-component monitoring system. The following parts are built into the Prometheus deployment:

  • The Prometheus server scrapes and stores time series data. It also provides a user interface for querying metrics.

  • The Alertmanager takes care of real-time alerts based on triggers

Why Choose The Prometheus Operator?

Kubernetes provides many objects (pods, deploys, services, ingress, etc.) for deploying applications. Kubernetes allows you to create custom resources via custom resource definitions (CRDs).

Prometheus Operator saves you time in installing and maintaining Prometheus. Provides monitoring objects for dynamically collecting metrics without updating the Prometheus configuration.

Deploying Prometheus With The Operator

kube-prometheus-stack is a series of Kubernetes manifests, Grafana dashboards, and Prometheus rules. Make use of Prometheus using the operator to provide easy-to-use end-to-end monitoring of Kubernetes clusters.

Installing Helm

$ brew install helm

Not using Mac?

Take a look at this documentation, to find the appropriate setup for you: https://helm.sh/docs/intro/install/#through-package-managers

Creating the dedicated monitoring namespace

In Kubernetes, namespaces provide a mechanism for isolating groups of resources within a single cluster. We create a namespace named monitoring to prepare the new deployment:

$ kubectl create namespace monitoring

Installing kube-prometheus-stack with Helm

Add the Prometheus chart repository and update the local cache:

$ helm repo add prometheus-community https://prometheus-community.github.io/helm-charts$ helm repo update

Deploy the kube-stack-prometheus chart in the namespace monitoring with Helm:

$ helm upgrade --namespace monitoring --install kube-stack-prometheus prometheus-community/kube-prometheus-stack --set prometheus-node-exporter.hostRootFsMount.enabled=false

hostRootFsMount.enabled is to be set to false to work on Docker Desktop on Macbook.

Now, CRDs are installed in the namespace. You can verify with the following kubectl command:

$ kubectl get -n monitoring crds                                                           NAME                                        CREATED ATalertmanagerconfigs.monitoring.coreos.com   2022-03-15T10:54:41Zalertmanagers.monitoring.coreos.com         2022-03-15T10:54:42Zpodmonitors.monitoring.coreos.com           2022-03-15T10:54:42Zprobes.monitoring.coreos.com                2022-03-15T10:54:42Zprometheuses.monitoring.coreos.com          2022-03-15T10:54:42Zprometheusrules.monitoring.coreos.com       2022-03-15T10:54:42Zservicemonitors.monitoring.coreos.com       2022-03-15T10:54:42Zthanosrulers.monitoring.coreos.com          2022-03-15T10:54:42Z

Here is what we have running now in the namespace:

The chart has installed Prometheus components and Operator, Grafana — and the following exporters:

Our monitoring stack with Prometheus and Grafana is up and ready!

Connecting To Prometheus Web Interface

The Prometheus web UI is accessible through port-forward with this command:
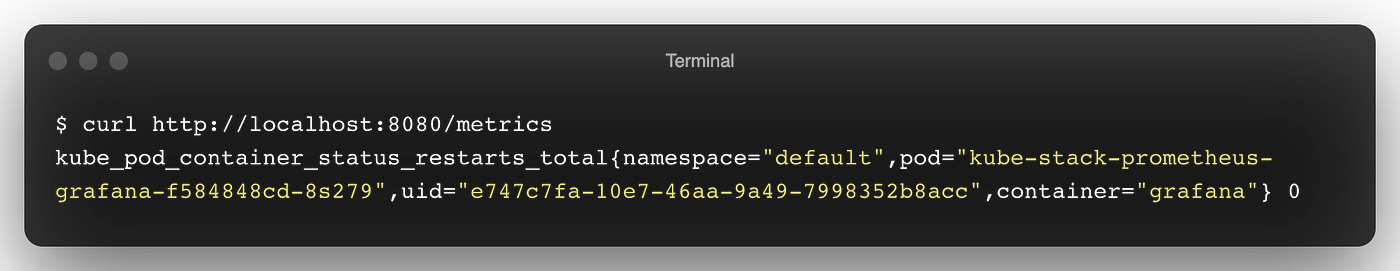
$ kubectl port-forward --namespace monitoring svc/kube-stack-prometheus-kube-prometheus 9090:9090

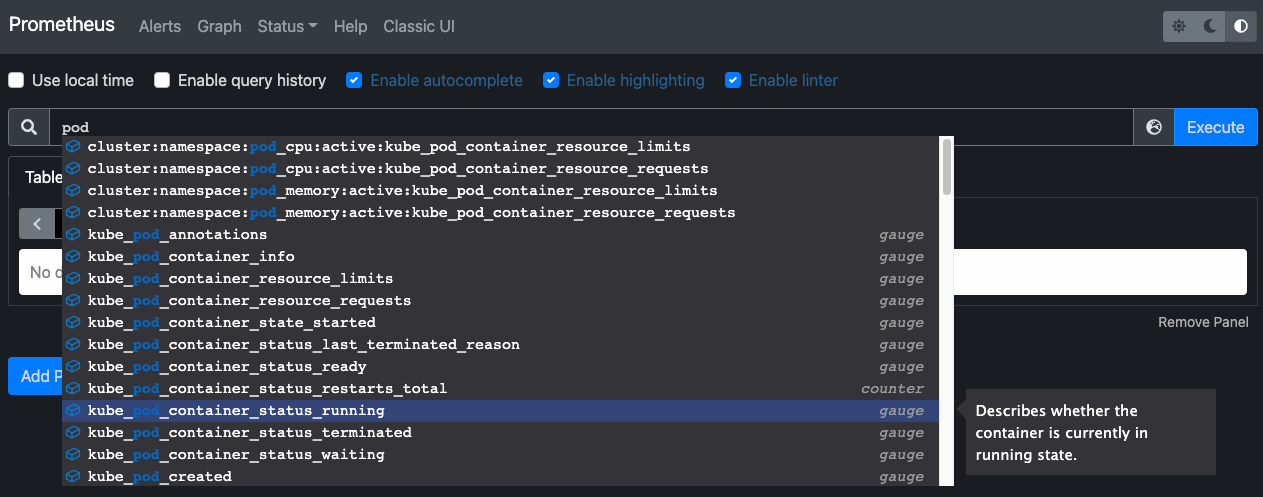
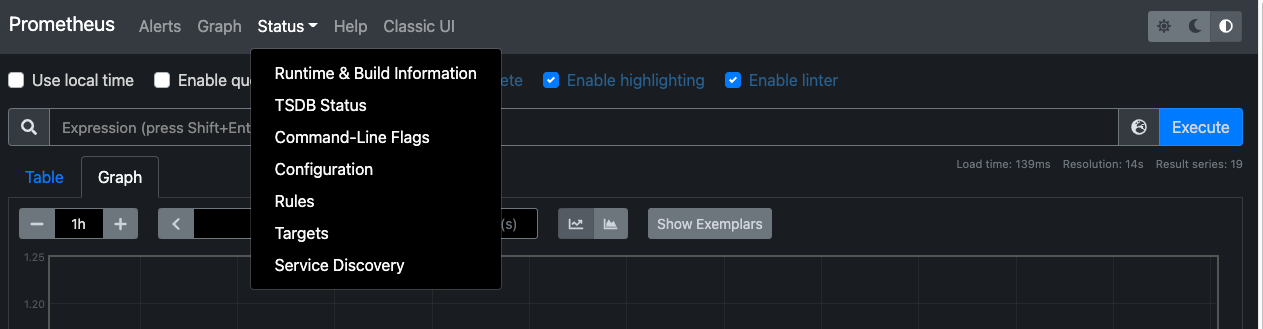
Going to the “Status>Targets” and you can see all the metric endpoints discovered by the Prometheus server:

Connecting To Grafana

The credentials to connect to the Grafana web interface are stored in a Kubernetes Secret and encoded in base64. We retrieve the username/password couple with these two commands:

$ kubectl get secret --namespace monitoring kube-stack-prometheus-grafana -o jsonpath='{.data.admin-user}' | base64 -d$ kubectl get secret --namespace monitoring kube-stack-prometheus-grafana -o jsonpath='{.data.admin-password}' | base64 -d

We create the port-forward to Grafana with the following command:
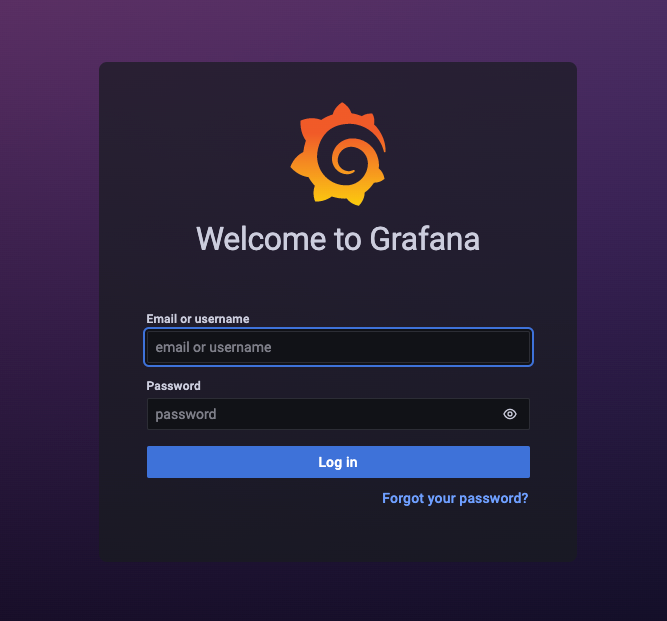
$ kubectl port-forward --namespace monitoring svc/kube-stack-prometheus-grafana 8080:80

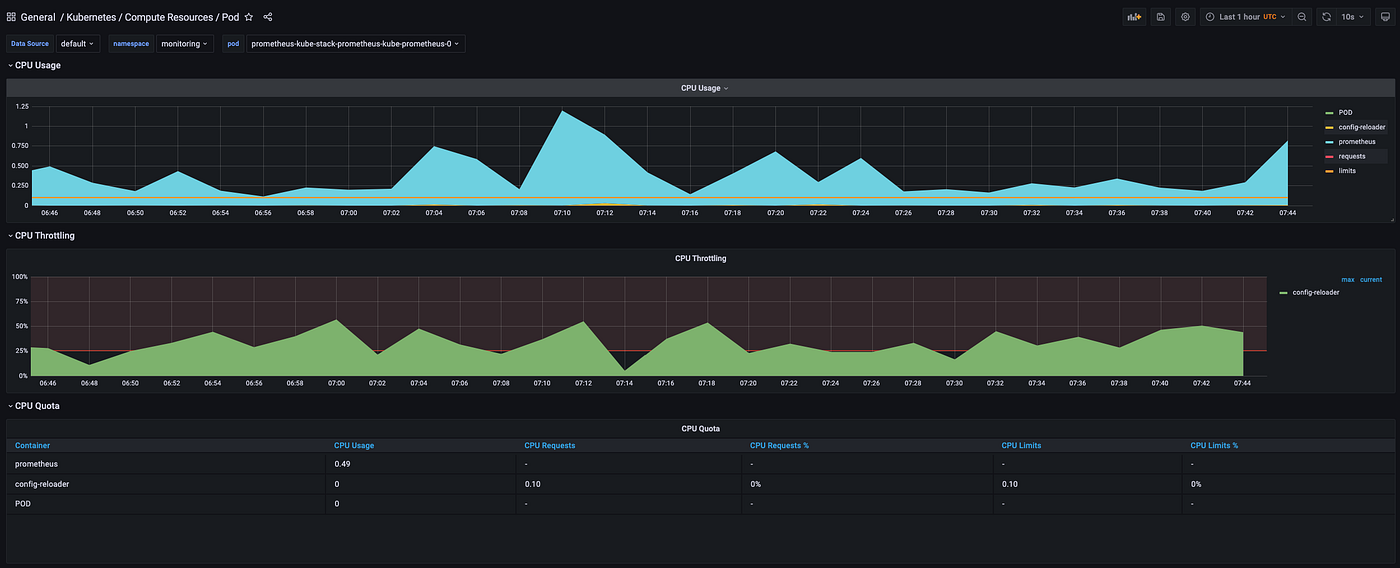
The kube-stack-prometheus deployment has provisioned Grafana dashboards:

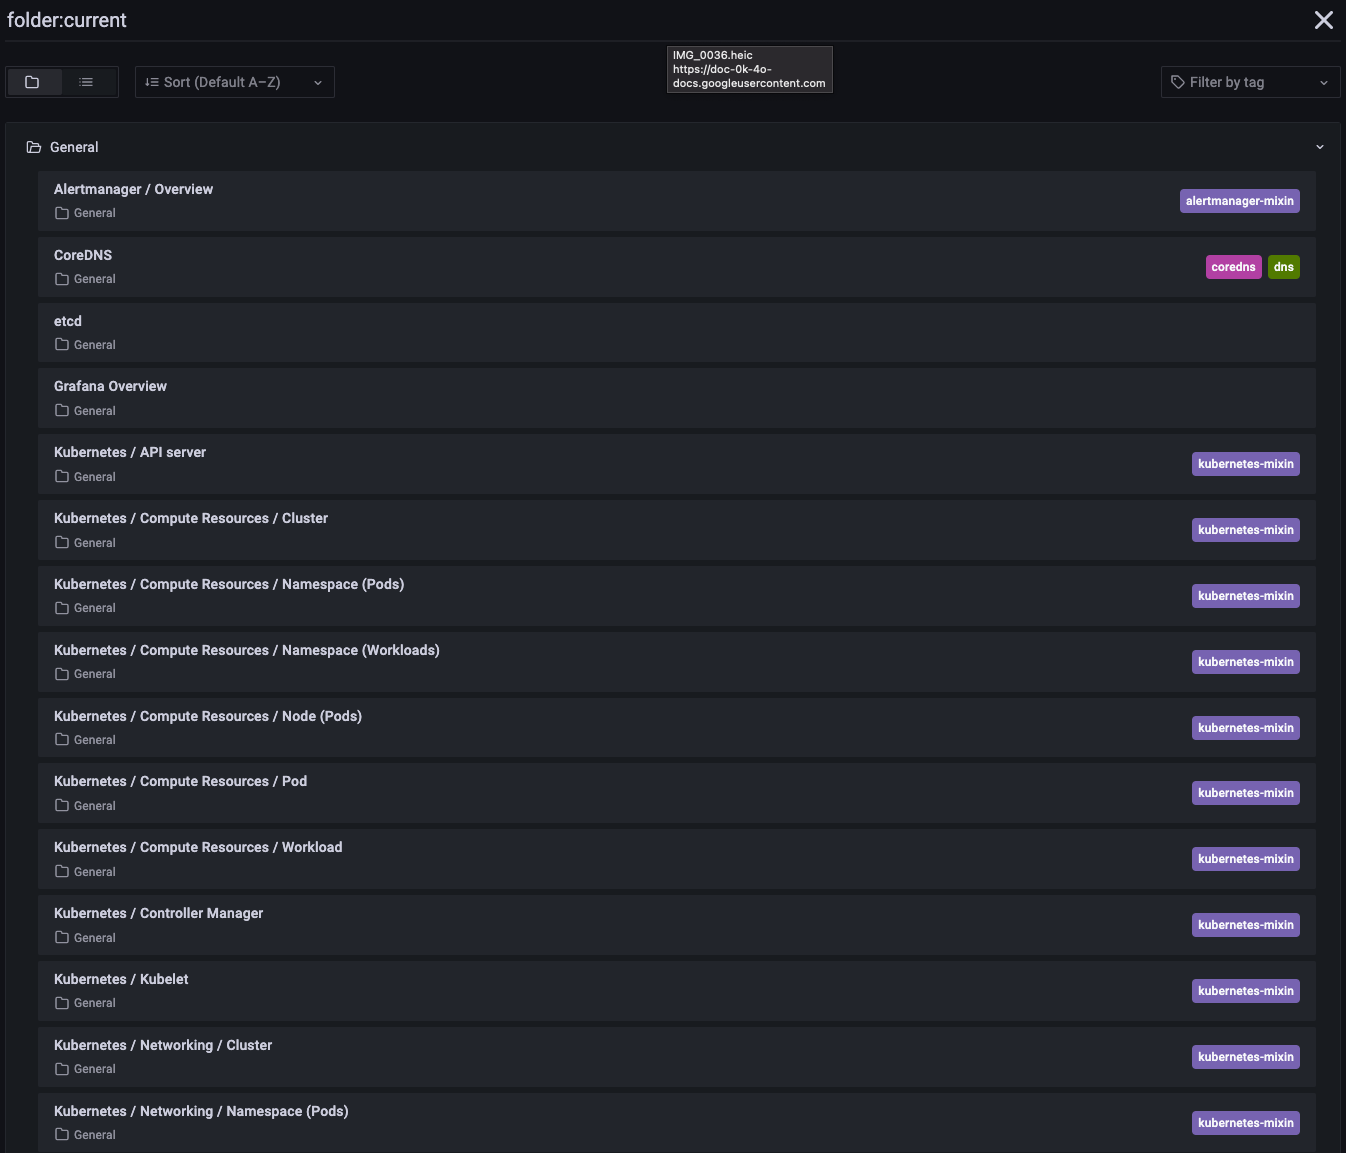
Here we can see one of them showing compute resources of Kubernetes pods:

That’s all folks. Today, we looked at installing Grafana and Prometheus on our K8s Cluster.

Prometheus is considered Kubernetes’ default monitoring solution and was inspired by Google’s . Use HTTP pull requests to collect metrics from your application and infrastructure. It’s targets are discovered via service discovery or static configuration. Time series push is supported through the intermediate gateway.

The are used for instrumenting application code.

supports collecting metrics from short-lived jobs.

Prometheus also has a service for services that do not directly instrument metrics.

The CRD object implements the final application behavior. This improves maintainability and reduces deployment effort. When using the , each component of the architecture is taken from the CRD. This makes Prometheus setup easier than traditional installations.

Prometheus Classic installation requires a server configuration update to add new metric endpoints. This allows you to register a new endpoint as a target for collecting metrics. Prometheus operators use monitor objects (, ) to dynamically discover endpoints and scrape metrics.

This collection is available and can be deployed using a Helm Chart. You can deploy your monitor stack from a single command line-first time with Helm? Check out this for a helm tutorial.

exposes hardware and OS metrics

listens to the Kubernetes API server and generates metrics about the state of the objects

Opening a browser tab on shows the Prometheus web UI. We can retrieve the metrics collected from exporters:

Open your browser and go to and fill in previous credentials:

🔄
Borgman
Client libraries
Pushgateway
exporter
Prometheus operator
PodMonitor
ServiceMonitor
Github Link
article
prometheus-node-exporter
kube-state-metrics
http://localhost:9090
http://localhost:8080