14. Telemetry
A beginner’s guide to OpenTelemetry
OpenTelemetry is a collection of tools, APIs, and SDKs.

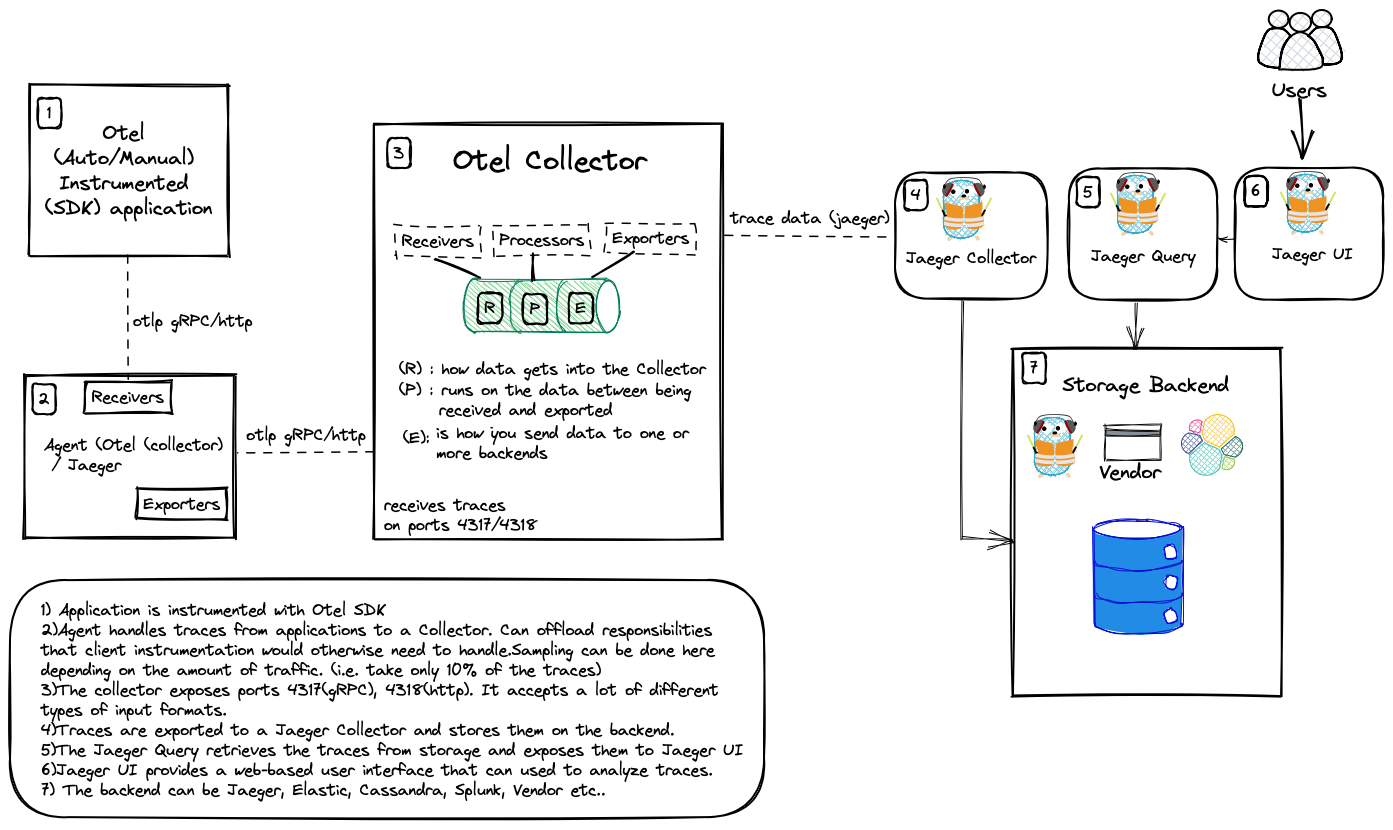
Instrument the application using OpenTelemetry SDK.
Traces are sent to a (collector) agent.
The collector exposes ports 4317(gRPC) and/or 4318(http) using OTLP.
Traces are then exported (in this case to Jaeger) and stores the traces on the backend
The Jaeger Query retrieves the traces and expose them to the Jaeger UI.
Jaeger UI provides a web based user interface that can be used to analyse traces.
What is OpenTelemetry?
OpenTelemetry gives us the tools to create trace data. It provides a vendor agnostic standard for observability as it aims to standardise the generation of traces.
This is good, because that means that we are not tied to any tool (or vendor). Not only can we use any programming language we want, but we can also pick and choose the storage backend, thus avoiding a potential buy in from commercial vendors.

It also means that developers can instrument their application without having to know where the data will be stored.
OpenTelemetry API
Defines how OpenTelemetry is used.
OpenTelemetry SDK
Defines the specific implementation of the API for a language.
Instrumentation
As you can see from the image (at the top), in order to get trace data, we first need to instrument the application. To collect the trace data, we can use the OpenTelemetry SDK.
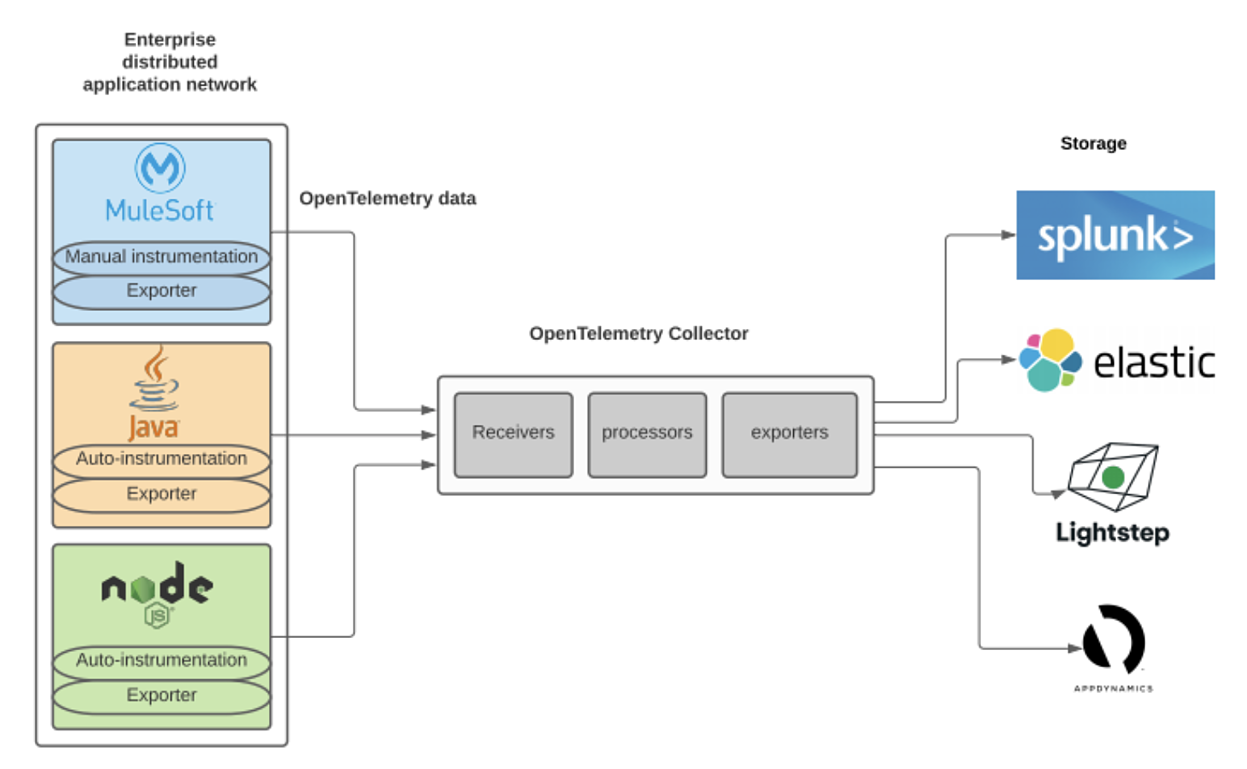
The trace data can be generated using either automatic or manual (or a mix) instrumentation.
To instrument your application with OpenTelemetry, go to the OpenTelemetry repository, and pick the language for your application and follow the instructions.
Auto Instrumentation
One of the best ways to instrument applications is to use OpenTelemetry automatic instrumentation (auto-instrumentation). This approach is simple, easy, and doesn’t require many code changes.
Using auto-instrumentation libraries, means that you don’t need to write code for the trace information to be collected. In fact, OpenTelemetry offers an API and SDK that allows for easy bootstrapping of distributed tracing into your software.
This is good to know if don’t have the necessary knowledge (or time) to create a tracing framework tailored for your application.
On OpenTelemetry Registry you can search for libraries, plugins, integrations, and other useful tools for extending OpenTelemetry.
For example, running the following command will automatically instrument your python code.
opentelemetry-instrument python app.py
When you use auto instrumentation, a predefined sets off spans will be created for you and populated with relevant attributes.
Manual Instrumentation
Manual instrumentation is when you write specific code for your application. It’s the process of adding observability code to your application. This can more effectively suit your needs. For example, you can add attributes and events.
Once you have collected trace data, you need to send it somewhere.
OpenTelemetry Protocol
OpenTelemetry Protocol (OTLP) specification describes the encoding, transport, and delivery mechanism of telemetry data between telemetry sources, intermediate nodes such as collectors and telemetry backends. source
The OTLP protocol describes how to encode and transmit telemetry data, which makes it a natural choice for data transport. Each language SDK provides an OTLP exporter you can configure to export data over OTLP. The OpenTelemetry SDK then transforms events into OTLP data.
OpenTelemetry Collector
The data from your instrumented application can be sent to an OpenTelemetry collector.
The collector is a component of OpenTelemetry that collects trace data (spans, metrics, logs etc) process (pre-processes data), and exports the data (sends it off to a backend that you want to talk to).
The OpenTelemetry collector can receive telemetry data in multiple formats.

How to configure the OpenTelemetry Collector
Agent vs Gateway
The collector can be setup as an agent or as a gateway.
We usually first send traces to a (collector) agent. This (collector) agent handles the trace data from the instrumented application.
The (collector) agent can offload responsibilities that the client instrumentation otherwise need to handle. This includes batching, retry, encryption, compression and more.
You can also perform sampling here depending on the amount of traces/traffic you want to send. (ie. take only 10% of the traces).
You need to configure receivers (how data gets into the collector), which then transform the data (process) before sending it to one or more backends using exporters.
Receivers
Here we configure a receiver (on the collector) that accepts OTLP data on port 4317 (gRPC). (You also need to configure your application to export over OTLP to use it)
In our OpenTelemetry on Kubernetes article, we will talk about this in more detail and also show how you can deploy this on a local Kubernetes cluster.
Exporters
Once you’ve instrumented your code, you need to get the data out in order to do anything useful with it. OpenTelemetry comes with a variety of exporters.
The exporters converts OpenTelemetry protocol (OTLP) formatted data to their respective predefined back-end format and exports this data to be interpreted by the back-end or system.
For example, for metrics, there is a Prometheus exporter that allows sending metrics so that Prometheus can consume it.
A common scenario (especially during testing), is to export all data directly to Jaeger using the jaeger-exporter.
In our OpenTelemetry on Kubernetes article, we will talk about this in more detail and also show how you can deploy this on a local Kubernetes cluster.
You can read more about exporters here
Storage Backends
It’s important to know that the OpenTelemetry collector does not provides their own backend.
The storage backend can be Jaeger, Zipkin, Elastic, Cassandra, Tempo, Splunk, a vendor (Honeycomb, Lightstep, Signoz, Logz.io, Aspecto etc..).
For a full list of storage alternatives, please checkout the Awesome OpenTelemetry repository.
OpenTelemetry on Kubernetes
This OpenTelemetry repo provides a complete demo on how you can deploy OpenTelemetry on Kubernetes.
Please check this article on how to deploy this on a local Kubernetes cluster.
Awesome OpenTelemetry
Checkout Awesome-OpenTelemetry to quickly get started with OpenTelemetry. This repo contains a big list of helpful resources.
Last updated
Was this helpful?