
Tracing
Pre-reads
https://github.com/egovernments/core-docs/blob/2.9-LTS/get-started/operations-guide/observability/broken-reference/README.mdThis doc covers the steps on how to deploy an OpenTelemetry collector on Kubernetes. We will then use an OTEL instrumented (Go) application provided by OpenTelemetry to send traces to the Collector. From there, we will bring the trace data to a Jaeger collector. Finally, the traces will be visualised using the Jaeger UI.
This image shows the flow between the application, OpenTelemetry collector and Jaeger.
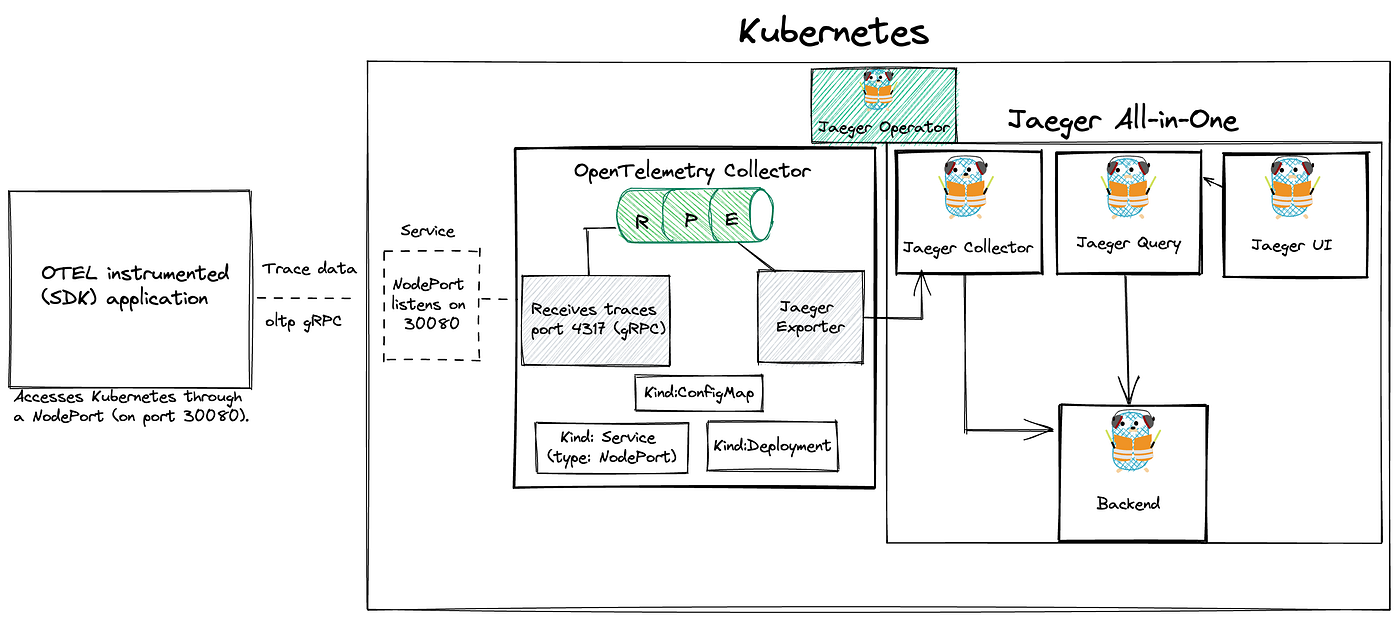
This OpenTelemetry repository provides a complete demo on how you can deploy OpenTelemetry on Kubernetes, we can use this as a starting point.
Pre-requisites
To begin, we need a Kubernetes cluster you can use any of your existing Kubernetes clusters with the apx 2vCPUs, 4GB RAM, and 100GB Storage.
Local Kubernetes Cluster Setup
Skip this in case you have the existing cluster.
In case, you don't have the ready Kubernetes but you have a good local machine with at least 4GB RAM left, you can use a local instance of Kind. The application will access this Kubernetes cluster through a NodePort (on port 30080). So make sure this port is free.
To use NodePort with Kind, we need to first enable it.
Extra port mappings can be used to port forward to the kind nodes. This is a cross-platform option to get traffic into your kind cluster.
vim kind-config.yaml
Create the cluster with: kind create cluster --config kind-config.yaml
Once our Kubernetes cluster is up, we can start deploying Jaeger.
What is Jaeger?
Jaeger is an open-source distributed tracing system for tracing transactions between distributed services. It’s used for monitoring and troubleshooting complex microservices environments. By doing this, we can view traces and analyse the application’s behaviour.
Why do we need it?
Using a tracing system (like Jaeger) is especially important in microservices environments since they are considered a lot more difficult to debug than a single monolithic application.
Problems that Jaeger addresses?
Distributed tracing monitoring
Performance and latency optimisation
Root cause analysis
Service dependency analysis
Deploy Jaeger
To deploy Jaeger on the Kubernetes cluster, we can make use of the Jaeger operator.
Operators are pieces of software that ease the operational complexity of running another piece of software.
Deploy Jaeger Operator
You first install the Jaeger Operator on Kubernetes. This operator will then watch for new Jaeger custom resources (CR).
There are different ways of installing the Jaeger Operator on Kubernetes:
using Helm
using Deployment files
Before you start, pay attention to the Prerequisite section.
Since version 1.31 the Jaeger Operator uses webhooks to validate Jaeger custom resources (CRs). This requires an installed version of the cert-manager.
Installing Cert-Manager
cert-manager is a powerful and extensible X.509 certificate controller for Kubernetes and OpenShift workloads. It will obtain certificates from a variety of Issuers, both popular public Issuers as well as private Issuers, and ensure the certificates are valid and up-to-date, and will attempt to renew certificates at a configured time before expiry.
Installation of cert-manager of is very simple, just run:
By default, cert-manager will be installed into the cert-manager namespace.
You can verify the installation by following the instructions here
With cert-manager installed, let’s continue with the deployment of Jaeger
Installing Jaeger Operator Using Helm
Jump over to Artifact Hub and search for jaeger-operator
Add the Jaeger Tracing Helm repository:
helm repo add jaegertracing https://jaegertracing.github.io/helm-charts
To install the chart with the release name my-release (in the default namespace)
You can also install a specific version of the helm chart:
Verify that it’s installed on Kubernetes:
helm list -A
You can also deploy the Jaeger operator using deployment files.
kubectl create -f https://github.com/jaegertracing/jaeger-operator/releases/download/v1.36.0/jaeger-operator.yaml
At this point, there should be a jaeger-operator deployment available.
kubectl get deployment my-jaeger-operator
The operator is now ready to create Jaeger instances.
Deploy Jaeger All-in-One
The operator that we just installed doesn’t do anything itself, it just means that we can create jaeger resources/instances that we want the jaeger operator to manage.
The simplest possible way to create a Jaeger instance is by deploying the All-in-one strategy, which installs the all-in-one image, and includes the agents, collector, query and the Jaeger UI in a single pod using in-memory storage.
Create a yaml file like the following. The name of the Jaeger instance will be simplest
vim simplest.yaml
kubectl apply -f simplest.yaml
After a little while, a new in-memory all-in-one instance of Jaeger will be available, suitable for quick demos and development purposes.
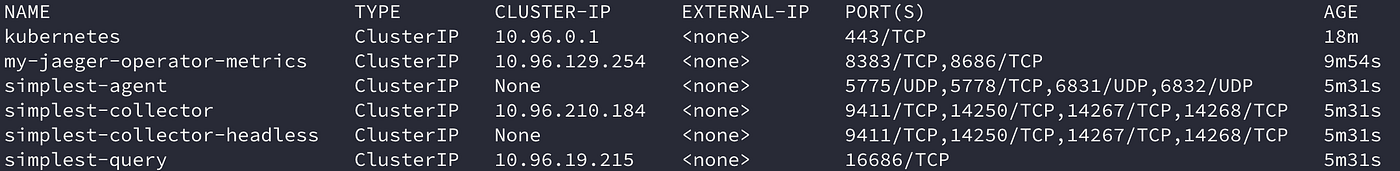
When the Jaeger instance is up and running, we can check the pods and services.
kubectl get pods
kubectl get services
To get the pod name, query for the pods belonging to the simplest Jaeger instance:
Query the logs from the pod:
kubectl logs -l app.kubernetes.io/instance=simplest
Let’s open the Jaeger UI
Use port-forwarding to access the Jaeger UI
kubectl port-forward svc/simplest-query 16686:16686
Jaeger UI

Deploy Open Telemetry Collector
To deploy the OpenTelemetry collector, we will use this otel-collector.yaml file as a starting point. The yaml file consists of a ConfigMap, Service and a Deployment.
vim otel-collector.yaml
Make sure to change the name of the jaeger collector (exporter) to match the one we deployed above. In our case, that would be:
Also, pay attention to receivers. This part creates the receiver on the Collector side and opens up the port 4317 for receiving traces, which enables the application to send data to the OpenTelemetry Collector.
Apply the file with: kubectl apply -f otel-collector.yaml
Verify that the OpenTelemetry Collector is up and running.
kubectl get deployment
kubectl logs deployment/otel-collector
Run Application
Time to send some trace data to our OpenTelemetry collector.
Remember, that the application access the Kubernetes cluster through a NodePort on port 30080. The Kubernetes service will bind the
4317port used to access the OTLP receiver to port30080on the Kubernetes node.By doing so, it makes it possible for us to access the Collector by using the static address
<node-ip>:30080. In case you are running a local cluster, this will belocalhost:30080. Source
This repository contains an (SDK) instrumented application written in Go, that simulates an application.
go run main.go
Viewing the data
Let’s check out the telemetry data generated by our sample application
Again, we can use port-forwarding to access Jaeger UI.
Open the web-browser and go to http://127.0.0.1:16686/
Under Service select test-service to view the generated traces.
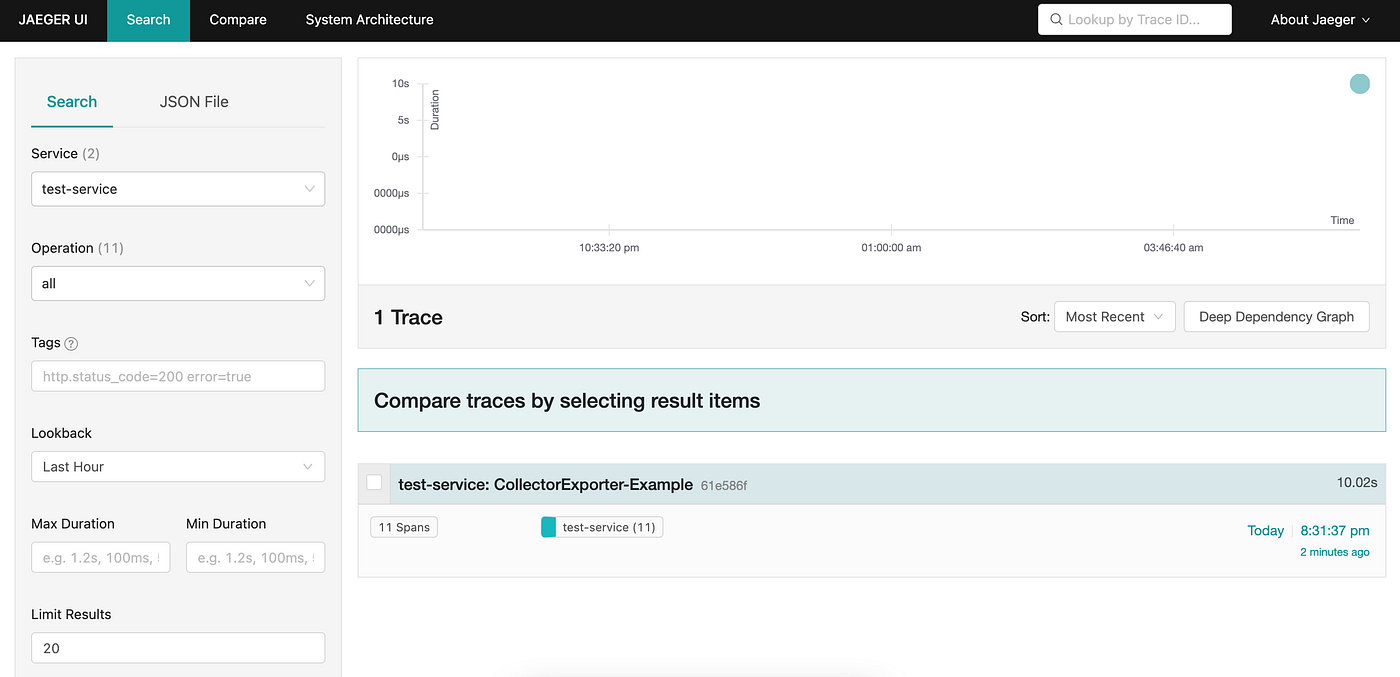
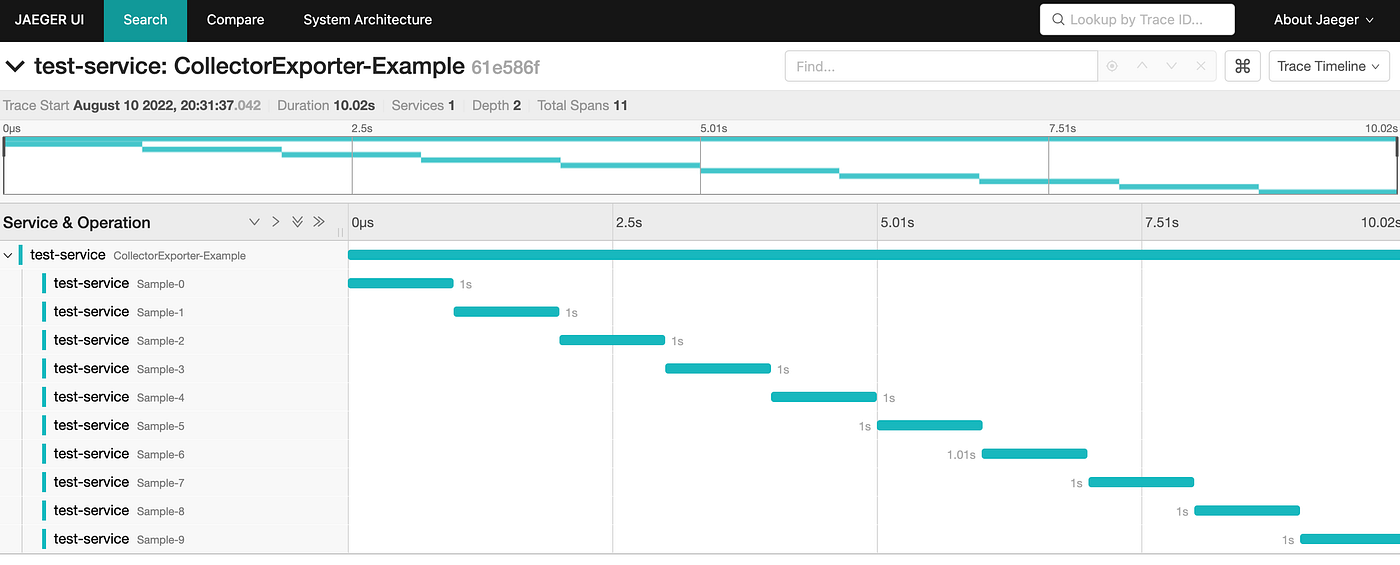
The service name is specified in the main.go file.
The application will access this Kubernetes cluster through a NodePort (on port 30080). The URL is specified here:
Done
This document has covered how we deploy an OpenTelemetry collector on Kubernetes. Then we sent trace data to this collector using an Otel SDK instrumented application written in Go. From there, the traces were sent to a Jaeger collector and visualised in Jaeger UI.
![]() All content on this page by eGov Foundation is licensed under a Creative Commons Attribution 4.0 International License.
All content on this page by eGov Foundation is licensed under a Creative Commons Attribution 4.0 International License.
Last updated
Was this helpful?